Home Temperature Monitor & Notification System (Do it yourself)
(fyi this post looks funky in Chrome, but it's fine using Firefox)
I built this system so I could have a fairly reliable temperature monitoring system at home so I would know if my a/c went out in the summer. Being in Phoenix where it can get to 120F and I have cats at home, I felt it was important to develop a reliable monitoring and alerting system.
This tutorial will guide you thru the setup and configuration of a home temperature monitoring system using a Raspberry Pi microcontroller. You can also do this with Arduino, but without an operating system like linux, it's far more difficult to accomplish everything we will cover here. If you've never used a microcontroller like a Pi or Arduino, it's recommended you get a breadboard and learn how they work before attempting to construct this project. You will need a small familiarity with linux, or at least the open mind to learn a few new things.
This is a fairly long tutorial so I will skip some minor items that aren't directly related to this topic. Google can cover those for you. There are also other ways to do this type of thing, but each way has its advantages and disadvantages. This is just the way I did it, plus I wrote the custom perl script as well as created and exported the cacti templates that will be used. This is also based off of the Ubuntu Repo install of cacti and nagios. If you install these from source instead, then you will need to make a few manual adjustments (but you knew that already).
This tutorial will eventually be outdated or I may have just forgotten something or misspelled a word here and there. Feel free to leave a comment if needed.
All terminal commands are shown as #, which is the start of the terminal prompt. You can (but dont have to) copy the text after the # and paste it directly into an SSH terminal window (like Putty).
UPDATE: I've discovered that this configuration cannot tolerate cable lengths over 100ft. So if you run any cables that come close to that length or more, then you should do a detailed check on the temperature readings for that zone. I have found that zones where the cable length is too long will submit bad temperature data. If longer cable lengths are a necessity for your project, you will need to look into using 1-wire protocol instead of this bus.
OBLIGATORY DISCLAIMER: I don't care how accurate my instructions are or are not. you should always do your own research and use your brain. therefore, it's not my fault if you brick your device, fall through the roof, or anything else. if you want support and liability, then go BUY A RETAIL PRODUCT!
Things you will need:
SSH should be enabled by default on your Pi. So you should be able to SSH to the pi and bypass the need for keyboard and monitor connections. This is optional but strongly recommended. In future steps you will need to paste data into the Pi, so SSH will be essential. if you dont know how to use SSH cleint/server, research it on google and know the Pi is the server and your laptop/desktop is the client.
Anyway, let's get the hardware connected. Refer to this image or google the GPIO pin layout to know what pins to use.


# nano generic-service_nagios2.cfg
Nagios package installers have some weird permissions bug so sometimes the images don't show up. If that happen, you will have to google how to resolve it as I have not yet found a clear solution to the issue.
Anyway, you should have a pseudo dashboard type environment now that nagios is running and it should look something like this. Using the host and service definitions, you can re-arrange your dashboard to make more sense to you and also remove the other services that came with Nagios.

In my example above, SSH is failing but that is because I use different SSH settings so you can disregard that. the real concern is the new service we added "Snoopy Cat Zone" which I know is confusing but whatever. the service output is reading as
Also, check the date/time stamps in this screen. If the date/time that nagios is using is not correct, you will need to update ntp on your OS. you can do this by running:
# echo -n > /etc/ntp.conf
# nano /etc/ntp.conf
Add this line:
# /etc/init.d/ntp restart
Now set your system clock's time zone
# dpkg-reconfigure tzdata
Select your local timezone from the list.
Now update your log rotation settings so your sd card doesnt fill up with logs.
# echo -n > /etc/logrotate.conf
# nano /etc/logrotate.conf
Paste this text into the editor, then save and exit.
# aptitude -y install sendmail
# sendmailconfig
Just answer Y to any question it asks unless you know what you are doing.
# apt-get -y install postfix
Use "Internet Site" when prompted and change the hostname if you need to, but it's not required.
# nano /etc/postfix/main.cf
scroll down to the end and adjust these settings as pictured:

Reboot and test
# reboot
# echo "test email" | /usr/sbin/sendmail user@gmail.com
replace the red font with your email address. this will send a test mail to that address.
Now go back to nagios and click on a service and you will see an option to send a custom service notification. check all boxes and enter some text then click COMMIT. it should send a notification assuming you defined a contact in the previous steps.
Now, let's setup a long-term monitoring system, aka Cacti. Cacti does not do any alerting. It only keeps track of the temperatures that nagios is also monitoring. Cacti stores every reading and over time you can get some decent data such as trends and spikes. So if you are wondering if a room has an air leak or another problem to maintain the temperature, you can use Cacti to get some helpful data.
Note: The rest from here is completely optional and not really needed.
Cacti has tons of problems and very little community support so finding answers using google doesn't usually work. see the screen shots below if you want to see what it can do.
# apt-get -y install cacti cacti-spine
It will ask you to define a password for the root user of MySQL. Write this password down.
Click OK when it warns you about a path change.
Select APACHE2 when it asks which web server to use.
click YES when it asks you to configure for db-common.
Set the password for the cacti admin user, write it down.
It will also ask you to set the password for the cacti database, write that one down as well.
Run this to set the permissions correctly:
# chmod 775 /var/lib/cacti/rra
# crontab -e
Add this line to the end of the file
*/5 * * * * /usr/bin/php /var/www/html/cacti/poller.php > /dev/null 2>&1
Save and exit.
Delete the config file
# rm -f /etc/dbconfig-common/cacti.conf
Now go to your cacti home page using your browser and the Pi's IP address:
Select NEW INSTALL and click NEXT
It will review all the required items. Everything should have a green [FOUND] indicating the item is already installed. If not, you will need to resolve these issues manually. But if you used the apt-get installer, then it should have installed everything for you.
Select Net-SNMP 5.x and RRDtool 1.4.x, click NEXT
It will take you to the login page. Username is admin. If you set a password just now, use that one. otherwise the default admin password should be either admin or cacti.
on the left, click SETTINGS, click POLLER,
Change Poller Type to SPINE
Make sure the poller interval and cron interval are set to 5 minutes.
Click SAVE.
on the left side, click IMPORT TEMPLATES
go back to https://github.com/bramuno/tempmon and click on the template files and copy the text. use the cacti import page to paste the text into the input box.
For "import rra settings" keep the recommended option.
For "associated rra's" use the CTRL key to select multiple options and select the frequency of the checks. I just selected them all.
Click IMPORT.
After both templates are imported, click DATA SOURCES
in the upper right corner, click ADD
select TEMPERATURE DATA TEMPLATE and Localhost, click CREATE
Change the Names as needed but leave the data source path alone unless you want the names to be accurate.
The items at the bottom are the custom variables required by the script we used in nagios. you should already have this info so go ahead and enter it here.
Click SAVE when done.
Now click GRAPH MANAGEMENT, in the upper right corner, click ADD
select TEMPERATURE DATA TEMPLATE and Localhost, click CREATE
Change only available drop down menu to TEMPERATURE GRAPH TEMPLATE then click CREATE.
Select the DATA SOURCE that you just created. it will be unique to each graph because the data source holds those custom variables.
Click SAVE.
On the left, click GRAPH MANAGEMENT on the left, then click the graph you just created.
at the top, click TURN ON GRAPH DEBUG MODE
The page will refresh and the graph should preview, although it will be empty at first. If the graph appears you are good. if it does not appear, run this:
# chmod +x /var/lib/cacti/rra/*
With working graphs, you can build your tree(s) now. on the left, click GRAPH TREES
Click ADD
Name the tree (eg. temperatures) and choose the ordering you prefer. click CREATE.
The page will refresh and the ADD link will move down a tad. Click ADD again to add items to this tree.
Parent Item is ROOT
Tree Item Type is GRAPH
Graph is the graph item you just created.
choose the round robin archive frequency and click SAVE (I just used one minute average)
Your tree item will now be listed.
Click GRAPHS tab at the top.
Click the tree you just created. the graphs are still empty, wait 30 minutes and try again. If still nothing, rebuild the poller cache again and wait another 30 minutes.
If your graphs aren't working (blank, showing NaN values, or broken images)...
If still no luck, try google.
Don't get too frustrated with Cacti. the truth is i've had problems almost every time I've used it. i am starting to notice that the debian package installations such as this one have more problems that the source installations. but the debian package installs have the option for auto upgrades while source installs do not. if you really need cacti and package installs arent working (apt-get) then remove the package and google how to do a manual install.
That's it. Nagios alerts you of the present condition while cacti tracks the data over time so you can see trends and such which could help you manage your heating or a/c bills. Now just find a permanent way to store this device and place your sensors. If you need advice, I suggest you locate the nearest hackerspace.
To update your software every 3-6 months, run
# apt-get upgrade
However, if you want it to do this automatically, just run
# crontab -e
and add this line to the file
After that, check to make sure everything still works. Problem is linux tends to break easy and things get outdated fast. check google for answers and roll with the punches. good luck!
UPDATE:
Here are some pictures of my setup. I turned my closet into a network closet but mounting a sheet of wood onto the wall and using that wood to mount devices. The Pi's network cable is plugged into the switch and the GPIO connections are going to another gray cable. Underneath the black electrical tape is how the GPIO cables connect to the sensor cables and the resistor. The blue cable is cat5 cable which has 8 smaller cables inside. This allows me to use 6 incoming temperature sensor data cables, and the other 2 cables are +12v and -12v.
The sensor cables run throughout the attic and down thru the walls to cat5 data plates.

Another thing that is giving me trouble is my living room sensor is placed rather high and I have vaulted ceilings. Since hot air rises, the temperature is warmer than in the rest of the house. So I am probably going to use a 2nd sensor more towards the floor and then average those 2 readings to make a more accurate room temperature.
My nagios & cacti installations are working as they should. Here are screen shots to compare yours. You can see how the temperature fluctuates as the heater goes on and back off.


I built this system so I could have a fairly reliable temperature monitoring system at home so I would know if my a/c went out in the summer. Being in Phoenix where it can get to 120F and I have cats at home, I felt it was important to develop a reliable monitoring and alerting system.
This tutorial will guide you thru the setup and configuration of a home temperature monitoring system using a Raspberry Pi microcontroller. You can also do this with Arduino, but without an operating system like linux, it's far more difficult to accomplish everything we will cover here. If you've never used a microcontroller like a Pi or Arduino, it's recommended you get a breadboard and learn how they work before attempting to construct this project. You will need a small familiarity with linux, or at least the open mind to learn a few new things.
This is a fairly long tutorial so I will skip some minor items that aren't directly related to this topic. Google can cover those for you. There are also other ways to do this type of thing, but each way has its advantages and disadvantages. This is just the way I did it, plus I wrote the custom perl script as well as created and exported the cacti templates that will be used. This is also based off of the Ubuntu Repo install of cacti and nagios. If you install these from source instead, then you will need to make a few manual adjustments (but you knew that already).
This tutorial will eventually be outdated or I may have just forgotten something or misspelled a word here and there. Feel free to leave a comment if needed.
All terminal commands are shown as #, which is the start of the terminal prompt. You can (but dont have to) copy the text after the # and paste it directly into an SSH terminal window (like Putty).
UPDATE: I've discovered that this configuration cannot tolerate cable lengths over 100ft. So if you run any cables that come close to that length or more, then you should do a detailed check on the temperature readings for that zone. I have found that zones where the cable length is too long will submit bad temperature data. If longer cable lengths are a necessity for your project, you will need to look into using 1-wire protocol instead of this bus.
OBLIGATORY DISCLAIMER: I don't care how accurate my instructions are or are not. you should always do your own research and use your brain. therefore, it's not my fault if you brick your device, fall through the roof, or anything else. if you want support and liability, then go BUY A RETAIL PRODUCT!
Things you will need:
- Raspberry Pi (version A or B is fine)
- SD Card (8gb or larger, class 4 or higher)
- SD card to USB adapater
- Low voltage wire, cat5 cable works fine
- DS18B20 temperature sensors (one for each area you wish to monitor)
- micro-usb cable (to power your Raspberry Pi)
- One 4.7k ohm resistor
- Network cable to plug in to your router
- RCA cable or HDMI cable for video out from the Pi
- usb keyboard to connect to the Pi
Optional items that may help, at least in the early stages:
- breadboard
- jumper wires ( both male/male and female/male)
- alligator wires
- a laptop or desktop with SSH client (Ubuntu works great, if windows then download Putty)
In the final stages, you will want to make your device more permanent, so you may need:
- A soldering iron
- Raspberry Pi case
- empty circuit board
To begin, first you need to get your Pi up and running. Here are two decent articles to get Raspbian OS on your Pi.
This article is based on the Raspbian OS so make sure you don't download a different OS unless you know what you are doing. You can also buy SD cards that have the OS pre-installed and ready to go, but this article is not based on those cards so I can't advise that.
Once your first boot your Pi (at least the current version of Raspbian), it will auto run the Raspi-config utility. Here you can do the initial config of your Pi.
- Select option 1, "Expand filesystem"
- Now select option 2 "Change user password"
- Now select option 3 "Enable boot to Desktop/Scratch", at the next screen select the first option "Console Text console, requiring login (default)".
- Select option 4 "Internationalisation Options", change the Locale and Timezone per your area. If you select the wrong config, run this command at the main terminal to restart the Raspi-Config process to get back to this option.
# raspi-config
Typical US locale would be "en_US.UTF-8"
Keyboard layout should be the "Dell" option, but dont use the "English (UK)" option, use OTHER and then select the "English (US)" option assuming you are in the US or just change it to your preferred keymap. then just accept the defaults for everything else it asks you. - Leave the remaining options alone unless you know what you are doing, and then allow it to reboot as requested.
Now login to your Pi using the password you just set and username pi
Now change to root and stay there.
$ sudo -s
You should now be using root user account. Root should have # sign at the terminal instead of the $ sign.
Add a new user account so we don't need to use the default account
# useradd USERNAME
# useradd USERNAME
Now go ahead and update your password
# passwd USERNAME
Now add that user account to the list of sudoers
# visudo
scroll down to the area labeled "User privilege specification". Under this line you will see the sudo permissions set for user root. Duplicate this line but do not remove it. Change the username of the new line to the username of the account you just created. Unse CTRL-O to save and CTRL-X to quit.
Make your user folder
# mkdir /home/username
# chown username:username /home/username
Now switch to this account and test you can sudo:
# su - username
# sudo -s
If you can sudo with your new account, it's safe to delete the default account.
# userdel pi
# userdel pi
If it complains a process is still being used by pi, just reboot the pi then you can delete the account.
Next let's update the OS. Make sure the network cable is plugged into the Pi's network port and the other end of the cable should be in your home router. If you haven't done this yet, do it now and reboot just to make sure you have an IP address to use. Now let's update the pi:
# apt-get update
# apt-get -y upgrade
Reboot and go back to the root user account when ready, for all the build steps, just assume you need root access.
# reboot
So the hardware part of this article is based off of this article. Mainly because I wanted to keep things as simple as possible and also because the software part of that article is outdated and no longer available.
So first we need to add the modprobe commands to the startup script so we don't have to enter them every time the Pi boots.
# echo -n > /etc/rc.local
# nano /etc/rc.local
# nano /etc/rc.local
Add the following text to the file.
# /etc/rc.local
Now that the modprobe commands are set but not active, let's run the rc.local file so it's active. you won't need to run it again since it will run at each reboot of your Pi.
modprobe w1-gpio
modprobe w1-thermSave and exit. Now run the file to let it take effect for the net steps.
# /etc/rc.local
Now that the modprobe commands are set but not active, let's run the rc.local file so it's active. you won't need to run it again since it will run at each reboot of your Pi.
2015 update - Seems there's been a change to rPi of late. So you'll need to update another file before you continue here.
# nano /boot/config.txt
Add this line of text to the very end of the file
dtoverlay=w1-gpio
Save, exit and reboot. Then continue with the instructions.
SSH should be enabled by default on your Pi. So you should be able to SSH to the pi and bypass the need for keyboard and monitor connections. This is optional but strongly recommended. In future steps you will need to paste data into the Pi, so SSH will be essential. if you dont know how to use SSH cleint/server, research it on google and know the Pi is the server and your laptop/desktop is the client.
Anyway, let's get the hardware connected. Refer to this image or google the GPIO pin layout to know what pins to use.
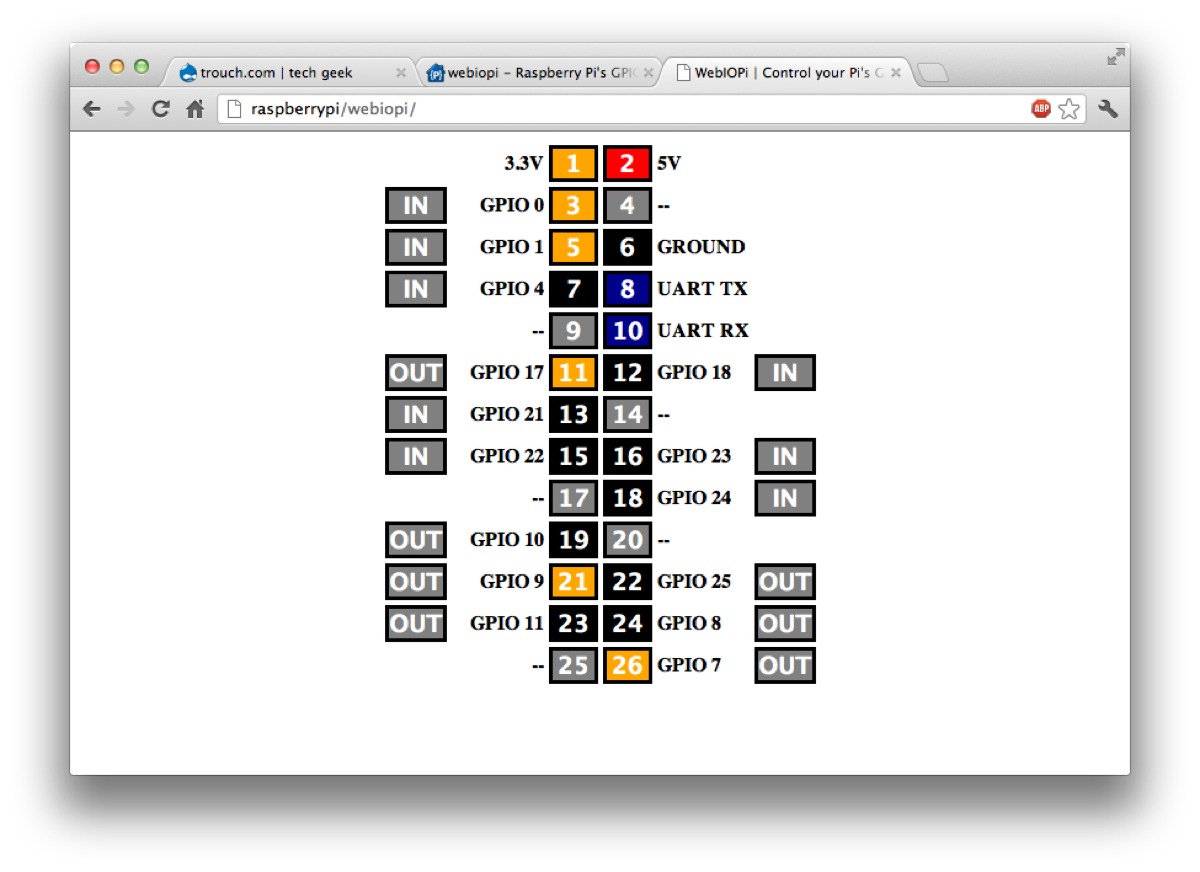
If you have multiple sensors, just start with one for now to verify everything works.
- connect the RED wire to the 3.3V pin on the Pi (aka pin #1)
NOTE: If you are connecting more than 5 sensors, connect the RED wire to the 5.0V pin instead (aka pin #2). - connect the BLACK wire to the ground pin (aka pin #6)
- the last cable is the data cable. in this case it's the yellow cable. connect the YELLOW wire to GPIO 4 pin (aka pin #7)
(Different vendors/sellers will color this wire differently. i've seen some that are white. in any case, the power is red/black, and the data cable is the other wire.) - connect one end of the resistor to the 3.3V pin and the other end goes to GPIO 4 pin.
this is where the alligator cables and jumper wires will come in handy because the pins are rather small. Here is a snap of my breadboard layout, but this is using 3 sensors at once. I connected the sensor to the Pi using alligator cables in between them.

In some cases, just connecting the pins caused a short circuit on my Pi so if your Pi stopped responding, just reboot. sometimes you may have to disconnect the ground, power on, then reconnect the ground.
Now that it's connected, it should be working since you already added the modprobe commands to the boot script.
Let's first make a shortcut to the devices folder
# cd /
# ln -s /sys/bus/w1/devices temp
# cd /temp
list the contents
# ls
you should see your sensor listed as a new folder starting with "28".

If there is nothing there or the previous commands say the folder doesn't exist, just reboot and try going to /temp again.
now go to that folder, but change the value to what your pi says, because this is just an example
# cd 28-0000053484b4
Now display the w1_slave file
# cat w1_slave
It will display a value of t=2xxxx at the end. this is your temperature in celcius. in the above example, the value of 21375 is really 21.375 degrees celcius. don't worry about converting it to farenheit, we will get to that later.
If the sensor is not working or improperly wired, you may see a value or 0, -61, or 85000. Otherwise the 28 folder just won't be there. In any of these cases, check your connections. No matter how many sensors you connect, you should only have ONE resistor.
Now that our sensor is working, it's time to get this hooked up to a monitoring system. Let's install nagios. Nagios is a monitoring and alerting system that we will re-purpose for monitoring the temperatures.
# apt-get -y install nagios3
It will install a ton of other things, but don't worry they are needed.
It will eventually ask you to set the nagiosadmin password. make sure you write down these passwords.
Once it's done, you should be able to visit your nagios via your laptop's web browser. Use the IP address of your Pi as the server name. for example:
http://192.168.1.100/nagios3
If you don't know the ipaddress of your Pi, run:
# ifconfig
Your IP address will be listed as 'inet addr' for device eth0.
It will ask you for a username and password. Use the nagiosadmin credentials you just created.
Now we need to add my custom script to the server. Nagios will use this script in the future. first make a new shortcut to the plugins folder:
# cd /
# ln -s /usr/lib/nagios/plugins plugins
# cd /plugins
Now create the new file and we'll add the code. This is where SSH is really helpful and almost required. You will need to paste the code into your SSH window. If you can't do that, then you will have to transfer the file to the Pi somehow. You may be able to remove the SD card to mount it to a usb adapter and add the file manually, but I honestly haven't tried that yet.
# nano myTemp.pl
Go to https://github.com/bramuno/tempmon/blob/master/myTemp.pl and copy the source code in your clipboard. then paste it into the SSH window. Save and exit.
# chmod +x myTemp.pl
The script is ready for manual use, but we want nagios to use it automatically. so let's edit some nagios config files.
# cd /etc/nagios3/
# nano commands.cfg
Go to the end of the file and add this text:
define command{
command_name check_temp
command_line /usr/bin/perl /usr/lib/nagios/plugins/myTemp.pl -x $_SERVICEMIN$ -y $_SERVICEMAX$ -f $_SERVICEFOLDER$ -t $_SERVICETYPE$ -z $_SERVICEZONE$ -p nagios
}
Now let's add the service definition:
# cd conf.d# nano generic-service_nagios2.cfg
Go to the end of the file and add this text:
define service{
name check_temp ;
active_checks_enabled 1 ;
passive_checks_enabled 1 ;
parallelize_check 1 ;
obsess_over_service 1 ;
check_freshness 0 ; Default is to NOT check service 'freshness'
notifications_enabled 1 ; Service notifications are enabled
event_handler_enabled 1 ;
flap_detection_enabled 0 ;
failure_prediction_enabled 0 ;
process_perf_data 0 ; Process performance data
retain_status_information 1 ; Retain status information across program restarts
retain_nonstatus_information 1 ; Retain non-status information across program restarts
notification_interval 15 ;
is_volatile 0 ;
check_period 24x7 ;
normal_check_interval 15 ;
retry_check_interval 10 ;
max_check_attempts 5 ;
notification_period 24x7 ;
notification_options w,c,r ;
servicegroups Temperatures
contact_groups tempAlerts ;
register 0 ;
}
You can adjust the values listed above as needed. Just don't mess with the groups until you get more familiar with nagios. The check values and interval values and such are in minutes, so you can change the frequency of checks as well as notifications. 1 is a yes or true while 0 is no or false.
# cd /etc/nagios3/conf.d/
# nano localhost_nagios2.cfg
You will see first a host definition and then 3 service definitions under that. these are the hosts and services that will be listed in the nagios web server in your browser. Included below are the templates for new hosts and new services. you will need to add this to the localhost_nagios2.cfg file and modify the info to your own preferences and specifics. The host definitions are somewhat optional as in this tutorial the service definitions are more important.
define host{
use generic-host ; leave this alone for now
host_name RaspPi ; don't use spaces here
alias my Raspberry Pi ; you can use spaces here if needed
address 127.0.0.1 ; local address, this is not used but required by nagios
}
define servicegroup{
servicegroup_name Temperatures
alias Temp Checks
}
define service{
use check_temp ; the name found in generic-service_nagios2.cfg
host_name RaspPi ; should be same as host definition name
check_command check_temp
service_description Snoopy Cats Zone ; this is what is listed in the nagios
_MIN 50 ; your minimum desired temperature for this zone
_MAX 100 ; your maximum desired temperature for this zone
_ZONE Office ; the name of this zone
_TYPE F ; F for Farenheit, C for Celcius
_FOLDER 28-000004cddb1e ; the name of the folder located at /temp
}
The items highlighted in GREEN are the items you need to adjust per your requirements.
- service_description is the name of the service as it will be seen in your nagios web page. It will likely be easier to just give it a name similar to _ZONE.
- _MIN is the lowest acceptable temperature nagios will accept. Anything lower to the nearest whole integer will cause nagios to send an alert. If your minimum is less than zero degrees, use n## format such as n20 to describe -20 degrees.
- _MAX is the highest acceptable temperature nagios will accept. Anything higher to the nearest whole integer will cause nagios to send an alert.
- _ZONE is the name of the area you are monitoring. So if nagios sends an alert, it will tell you to check this area.
- _TYPE is simply Farenheit vs Celcius, which do you prefer?
- _FOLDER is the name of the sensor's folder found in the /temp folder based on the previous steps above.
- _PROCESS is just to get the proper data returned to nagios. If you don't include this then all you get is the temperature and nothing soft and fuzzy. This will come in handy later on.
So in general, all you need to do is use the above template to create new "services" that will monitor each individual zone. Here is an example from my own personal cfg file:
define service{
use check_temp
host_name Kennels
check_command check_temp
service_description Snoopy Zone
_MIN 70
_MAX 100
_ZONE snoopy
_TYPE F ; F for Farenheit, C for Celcius
_FOLDER 28-000004cddb1e
_PROCESS nagios
}
define service{
use check_temp
host_name Office
check_command check_temp
service_description Snoopy Office Zone
_MIN 80
_MAX 100
_ZONE snoopy
_TYPE F ; F for Farenheit, C for Celcius
_FOLDER 28-000004cdfc113
_PROCESS nagios
}
Now edit the contacts file so nagios can alert you.
# nano /etc/nagios3/conf.d/contacts_nagios2.cfg
You will see the default contact, use that as a template if needed. Otherwise, just modify the info that's there and add your information. Then, add this text to the end of the file:
define contact{
contact_name Name_Goes_Here
alias Nickname(optional)
service_notification_period 24x7
host_notification_period 24x7
service_notification_options w,u,c,r ; what kind of service alerts to receive
host_notification_options d,r ; what kind of host alerts to receive
service_notification_commands notify-service-by-email
host_notification_commands notify-host-by-email
email name@email.com
}
define contactgroup{
contactgroup_name tempAlerts ; this value is defined in the generic-service_nagios2.cfg file
alias Temperature Alerts
members Name_Goes_Here ; this is the contact_name as defined in the "define contact" definition directly above this
}
Make the necessary adjustments to the highlighted text above, and make copies to add additional contacts as needed.
Save and exit.
We need to enable external commands, so edit the main nagios cfg file:
# nano /etc/nagios3/nagios.cfg
# nano /etc/nagios3/nagios.cfg
Use CTRL+W to search, type in external
You should find
check_external_commands=0
change this value to 1. Save and exit.
Now run these commands:
# /etc/init.d/nagios3 stop
# dpkg-statoverride --update --add nagios www-data 2710 /var/lib/nagios3/rw
# dpkg-statoverride --update --add nagios nagios 751 /var/lib/nagios3
# /etc/init.d/nagios3 start
Now we need to configure perl so nagios can use it.
# cpan
- Would you like to configure as much as possible automatically? [yes]
- Would you like me to automatically choose some CPAN mirror sites for you? (This means connecting to the Internet) [yes]
Now at the cpan shell, run these commands, say yes to anything it asks:
cpan> install CPANcpan> reload CPAN
cpan> install Math::Round
cpan> install Math::Round
cpan> quit
Now restart nagios:
# /etc/init.d/nagios3 restart
# /etc/init.d/nagios3 restart
Go back to your nagios web page via your browser, Refresh the browser and click on SERVICE GROUPS on the left menu. you should see the host(s) you listed in the config file. click on the host and you will see all the services for that host, which is really all the zones you are monitoring. Click the hostname again to get to the commands menu. Here you can use the link on the right side "RE-SCHEDULE A CHECK OF ALL SERVICES ON THIS HOST". this will initiate an immediate temperature check. Check the box labeled "FORCE CHECK" and click the COMMIT button. follow the links to go back,
Nagios package installers have some weird permissions bug so sometimes the images don't show up. If that happen, you will have to google how to resolve it as I have not yet found a clear solution to the issue.
Anyway, you should have a pseudo dashboard type environment now that nagios is running and it should look something like this. Using the host and service definitions, you can re-arrange your dashboard to make more sense to you and also remove the other services that came with Nagios.

In my example above, SSH is failing but that is because I use different SSH settings so you can disregard that. the real concern is the new service we added "Snoopy Cat Zone" which I know is confusing but whatever. the service output is reading as
Temperature: 70 degrees Farenheit. Threshold: 50-100 degrees Farenheit. Everything is ok.Since the temperature really is 70 degrees at my house, I know the temperature sensor is working. You will need to do your own confirmation. I suggest placing the sensor in the fridge and freezer for quick results.
Also, check the date/time stamps in this screen. If the date/time that nagios is using is not correct, you will need to update ntp on your OS. you can do this by running:
# echo -n > /etc/ntp.conf
# nano /etc/ntp.conf
Add this line:
server time.windows.comOr add whatever you want to use for ntp. Save and exit.
# /etc/init.d/ntp restart
Now set your system clock's time zone
# dpkg-reconfigure tzdata
Select your local timezone from the list.
Now update your log rotation settings so your sd card doesnt fill up with logs.
# echo -n > /etc/logrotate.conf
# nano /etc/logrotate.conf
Paste this text into the editor, then save and exit.
daily
rotate 7
create
/var/log/* {
create 0664 root root
}
/var/log/cacti/* {
create 0660 root root
}
/var/log/nagios/* {
create 0660 root root
}
/var/log/apache2/* {
create 0660 root rootHowever, Nagios can't send alerts yet because it has no mail transport. So let's do that:
}
# aptitude -y install sendmail
# sendmailconfig
Just answer Y to any question it asks unless you know what you are doing.
# apt-get -y install postfix
Use "Internet Site" when prompted and change the hostname if you need to, but it's not required.
# nano /etc/postfix/main.cf
scroll down to the end and adjust these settings as pictured:

- relayhost is your ISP's smtp server address, or the mail server that accepts mail requests on port 25.
- comment out the original mynetworks line with a # in front
- create a new mynetworks line and limit the IP range to the local pi (127.0.0.1) or your own local subnet, or whatever range of addresses you want to allow.
Reboot and test
# reboot
# echo "test email" | /usr/sbin/sendmail user@gmail.com
replace the red font with your email address. this will send a test mail to that address.
Now go back to nagios and click on a service and you will see an option to send a custom service notification. check all boxes and enter some text then click COMMIT. it should send a notification assuming you defined a contact in the previous steps.
Now, let's setup a long-term monitoring system, aka Cacti. Cacti does not do any alerting. It only keeps track of the temperatures that nagios is also monitoring. Cacti stores every reading and over time you can get some decent data such as trends and spikes. So if you are wondering if a room has an air leak or another problem to maintain the temperature, you can use Cacti to get some helpful data.
Note: The rest from here is completely optional and not really needed.
Cacti has tons of problems and very little community support so finding answers using google doesn't usually work. see the screen shots below if you want to see what it can do.
# apt-get -y install cacti cacti-spine
It will ask you to define a password for the root user of MySQL. Write this password down.
Click OK when it warns you about a path change.
Select APACHE2 when it asks which web server to use.
click YES when it asks you to configure for db-common.
Set the password for the cacti admin user, write it down.
It will also ask you to set the password for the cacti database, write that one down as well.
Run this to set the permissions correctly:
# chmod 775 /var/lib/cacti/rra
# crontab -e
Add this line to the end of the file
*/5 * * * * /usr/bin/php /var/www/html/cacti/poller.php > /dev/null 2>&1
Save and exit.
Delete the config file
# rm -f /etc/dbconfig-common/cacti.conf
Now go to your cacti home page using your browser and the Pi's IP address:
http://192.168.1.100/cactiit will redirect you to the setup page, click NEXT
Select NEW INSTALL and click NEXT
It will review all the required items. Everything should have a green [FOUND] indicating the item is already installed. If not, you will need to resolve these issues manually. But if you used the apt-get installer, then it should have installed everything for you.
Select Net-SNMP 5.x and RRDtool 1.4.x, click NEXT
It will take you to the login page. Username is admin. If you set a password just now, use that one. otherwise the default admin password should be either admin or cacti.
on the left, click SETTINGS, click POLLER,
Change Poller Type to SPINE
Make sure the poller interval and cron interval are set to 5 minutes.
Click SAVE.
on the left side, click IMPORT TEMPLATES
go back to https://github.com/bramuno/tempmon and click on the template files and copy the text. use the cacti import page to paste the text into the input box.
For "import rra settings" keep the recommended option.
For "associated rra's" use the CTRL key to select multiple options and select the frequency of the checks. I just selected them all.
Click IMPORT.
After both templates are imported, click DATA SOURCES
in the upper right corner, click ADD
select TEMPERATURE DATA TEMPLATE and Localhost, click CREATE
Change the Names as needed but leave the data source path alone unless you want the names to be accurate.
The items at the bottom are the custom variables required by the script we used in nagios. you should already have this info so go ahead and enter it here.
Click SAVE when done.
Now click GRAPH MANAGEMENT, in the upper right corner, click ADD
select TEMPERATURE DATA TEMPLATE and Localhost, click CREATE
Change only available drop down menu to TEMPERATURE GRAPH TEMPLATE then click CREATE.
Select the DATA SOURCE that you just created. it will be unique to each graph because the data source holds those custom variables.
Click SAVE.
On the left, click GRAPH MANAGEMENT on the left, then click the graph you just created.
at the top, click TURN ON GRAPH DEBUG MODE
The page will refresh and the graph should preview, although it will be empty at first. If the graph appears you are good. if it does not appear, run this:
# chmod +x /var/lib/cacti/rra/*
Refresh the page and try again.
If still no graph appears, go back to the data source and turn on debug mode. It will give you the code at the bottom and it will note the RRD file name. Make sure that RRD file exists. If not, wait 10 minutes as it should get created automatically. If it still doesnt, just paste that debug code into the SSH terminal and it will create the RRD file (the graph). run the above command again to mark it as executable.
If the graph still doesn't appear, you will need to ask Google how to fix it.
With working graphs, you can build your tree(s) now. on the left, click GRAPH TREES
Click ADD
Name the tree (eg. temperatures) and choose the ordering you prefer. click CREATE.
The page will refresh and the ADD link will move down a tad. Click ADD again to add items to this tree.
Parent Item is ROOT
Tree Item Type is GRAPH
Graph is the graph item you just created.
choose the round robin archive frequency and click SAVE (I just used one minute average)
Your tree item will now be listed.
Click GRAPHS tab at the top.
Click the tree you just created. the graphs are still empty, wait 30 minutes and try again. If still nothing, rebuild the poller cache again and wait another 30 minutes.
If your graphs aren't working (blank, showing NaN values, or broken images)...
- Try giving open permissions to all cacti files
# chmod -R 777 /usr/share/cacti/
# chmod -R 777 /var/lib/cacti - Verify the database settings are correct for spine. They should be the same as they are for cacti, unless you know what you are doing.
# nano /etc/cacti/spine.conf - last resort, try a re-installation but you want to use the purge option so it removes any traces of the install so you can start from scratch. I once spend all night trying to fix cacti when only a re-install did the trick.
# apt-get purge cacti cacti-spine
# apt-get install cacti cacti-spine - Then go back and perform the installation steps, including re-importing the templates and creating the data sources and graphs.
If still no luck, try google.
Don't get too frustrated with Cacti. the truth is i've had problems almost every time I've used it. i am starting to notice that the debian package installations such as this one have more problems that the source installations. but the debian package installs have the option for auto upgrades while source installs do not. if you really need cacti and package installs arent working (apt-get) then remove the package and google how to do a manual install.
That's it. Nagios alerts you of the present condition while cacti tracks the data over time so you can see trends and such which could help you manage your heating or a/c bills. Now just find a permanent way to store this device and place your sensors. If you need advice, I suggest you locate the nearest hackerspace.
To update your software every 3-6 months, run
# apt-get upgrade
However, if you want it to do this automatically, just run
# crontab -e
and add this line to the file
0 1 1 * * apt-get -y upgrade
Save and exit. This line will run the update on the first day of every month.
After that, check to make sure everything still works. Problem is linux tends to break easy and things get outdated fast. check google for answers and roll with the punches. good luck!
UPDATE:
Here are some pictures of my setup. I turned my closet into a network closet but mounting a sheet of wood onto the wall and using that wood to mount devices. The Pi's network cable is plugged into the switch and the GPIO connections are going to another gray cable. Underneath the black electrical tape is how the GPIO cables connect to the sensor cables and the resistor. The blue cable is cat5 cable which has 8 smaller cables inside. This allows me to use 6 incoming temperature sensor data cables, and the other 2 cables are +12v and -12v.


The sensor cables run throughout the attic and down thru the walls to cat5 data plates.
Another thing that is giving me trouble is my living room sensor is placed rather high and I have vaulted ceilings. Since hot air rises, the temperature is warmer than in the rest of the house. So I am probably going to use a 2nd sensor more towards the floor and then average those 2 readings to make a more accurate room temperature.
My nagios & cacti installations are working as they should. Here are screen shots to compare yours. You can see how the temperature fluctuates as the heater goes on and back off.


Very informative blog! server room temperature monitoring system very important to maintain the room temperature and humidity as well as.
ReplyDelete